EVOLUTION OF A TRADER
Just go back to the time when you are trying to learn how to ride a bicycle. You fall again and again learning how to ride a bicycle. You buy a small bicycle with training wheels or ask your dad/friend to hold the bicycle while riding it.
DreamTai is just like that bicycle with training wheels or like a friend who gives you feedback.
It will not predict the market. Rather, just like the friend, it will warn you through the color of the price bars, that now price is turning bearish, so it is not wise to buy now, or now the price bar has turned green and it is ok to buy the stock.
Also, it will show you the stop loss price (blue line), which is the price you have to get out if the stock does not go your way.
It is just like an honest friend, who does not sugar coat the truth and it just tells the market as it exists now.
It does not give you false hope or promises by predicting the future, but aims to protect you from losing money by entering counter trend trades or not getting out when you are losing money.
Here is how a trader evolves through various stages:
STAGE 1. FOR NEW TRADERS (LEVEL 0 traders) SYSTEM TRADERS
If you are a new trader, just select 4 or 5 stocks and follow the signals of DreamTai. You should just paper trade instead of spending real money.
If the bar is red color, just sell/short the stock. If the bar is green color, just buy the stock.
Get out of the position if the price moves beyond the stop loss line (blue line) Do not try to over-analyze the market. Just follow the system and see how you are performing. Carefully note down your daily trades, weekly profits/losses, monthly profit /losses.
See which stocks make money using this systems and which stocks lose money using this system.
By doing this exercise, you get a good idea on how the markets work and how Dreamtai is interpreting the market trends and get familiar with the DreamTai signals.
There will be some losses. Do not get discouraged. The losses are just a part of this business.
If you own a restaurant, then on some days, you have to throw away extra food because no one had purchased it and you can not store the stale food. Just like that, there will be some losses. You have to accept that. But overall, you should make money.
Carefully look at your weekly and monthly win/loss ratio. How many times you are winning and what is the percentage amount you are winning and what is the dollar amount you are winning versus the amount you are losing.
If overall you are having a low win rate AND a low Dollar winning amount, that means there is some problem. You will have to analyze your trades and see what has happened to cause such a poor performance.
Was it because you did not follow the rules?
Or was the loss because of some unexpected market event like the flash crash which occurred in May 2010.
Or was it because of the type of stocks you had selected. Maybe you had selected a stock that just moves in a trading range and is trendless.
After papertrading, switch to trading with real money when you are confident of yourself..
If you just follow the system, you will never learn on your own on how to interpret the stock charts. For that reason, you should evolve to stage 2 trader.
2. FOR TRADERS WITH SLIGHTLY MORE EXPERIENCE (LEVEL 1 TRADERS) MARKET STRUCTURE TRADERS
Now, if you have got used to DreamTai signals and risk prevention by stop losses, you can go ahead and start learning about the market structure.
Here you will learn how the market works. There is a definite structure to the market and if you take time, you can understand it and know that the structure repeats itself.
It may not repeat exactly, but the pattern repeats itself over time.
Here is more information about the market structure.
Interpreting the Market Structure
On the stock chart, you will notice two dotted moving average lines. The green dotted line is the 20 day moving average line and the red dotted line is the 50 days moving average line.
If the following three (or preferably four) conditions are met, the stock is bullish.
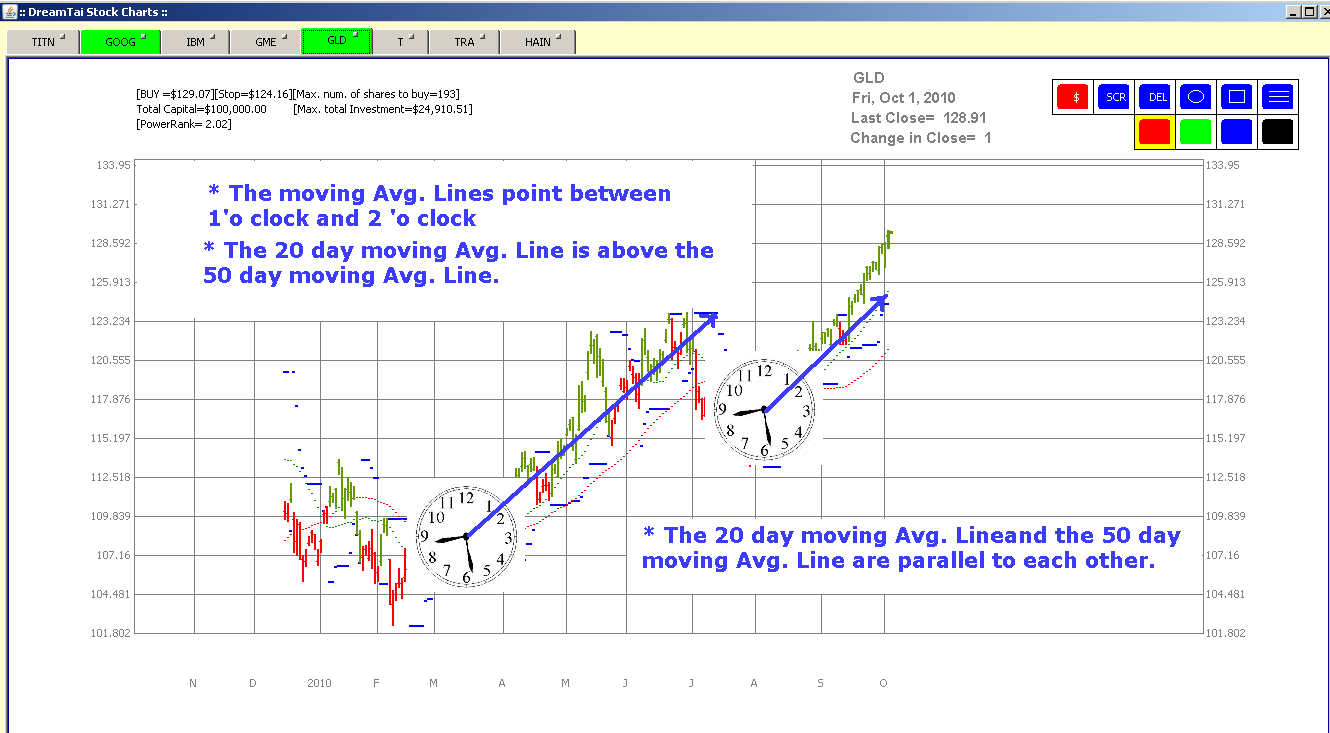
1. The 20 day average line is above the 50 day average line
2. The moving average dotted lines are pointing upwards (between 1 o clock and 2 o clock clock positions),
3. The moving average lines should move smoothly upwards, almost parallel to each other.
4. The Power Ranking is greater than 3 (This is preferable)
Any Power Ranking above 3 denotes that the buyers outnumber the sellers in a large way.
Also, the stock should not touch a lot below the 50 day moving average. When the stock pulls back, it can go back to 20 days moving average or go lower to the area between the 20 day moving average and 50 day moving average.
If it touches the 50 days moving average many times, it shows that the stock has internal weakness. Touching the 50 days moving average once or twice is OK.
If the conditions above are met, then the chances are that the stock will move upwards.
Let us look at an example.
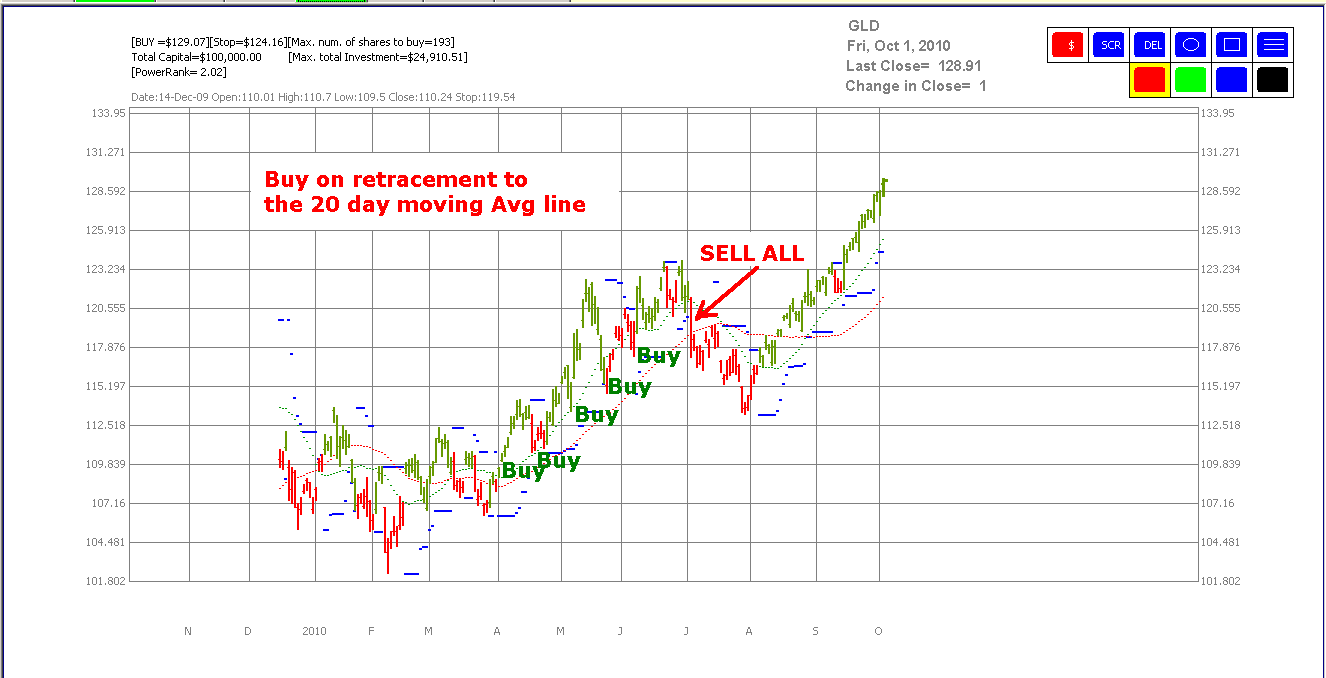
Here is the chart of a stock with ticker symbol GLD.
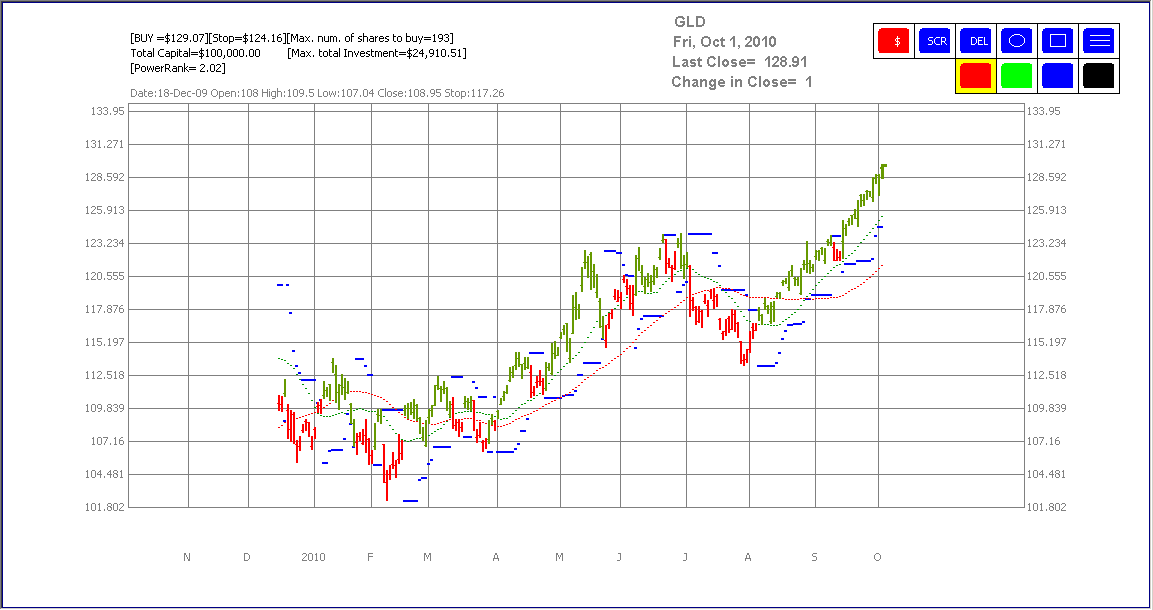
Let us check if it is bullish or not.
First, the 20 day moving average is above the 50 day moving average. Also, the moving average lines are pointing upwards between 1 o clock and 2 o clock positions. Also, the two moving average lines are moving smoothly upwards parallel to each other. The stock does not touch the 50 day moving average. It just bounces around the 20 day moving average line.
The Power Ranking is not so great. It should be preferably above 3. But still, we can say based on the other conditions that the stock is in a valid uptrend.
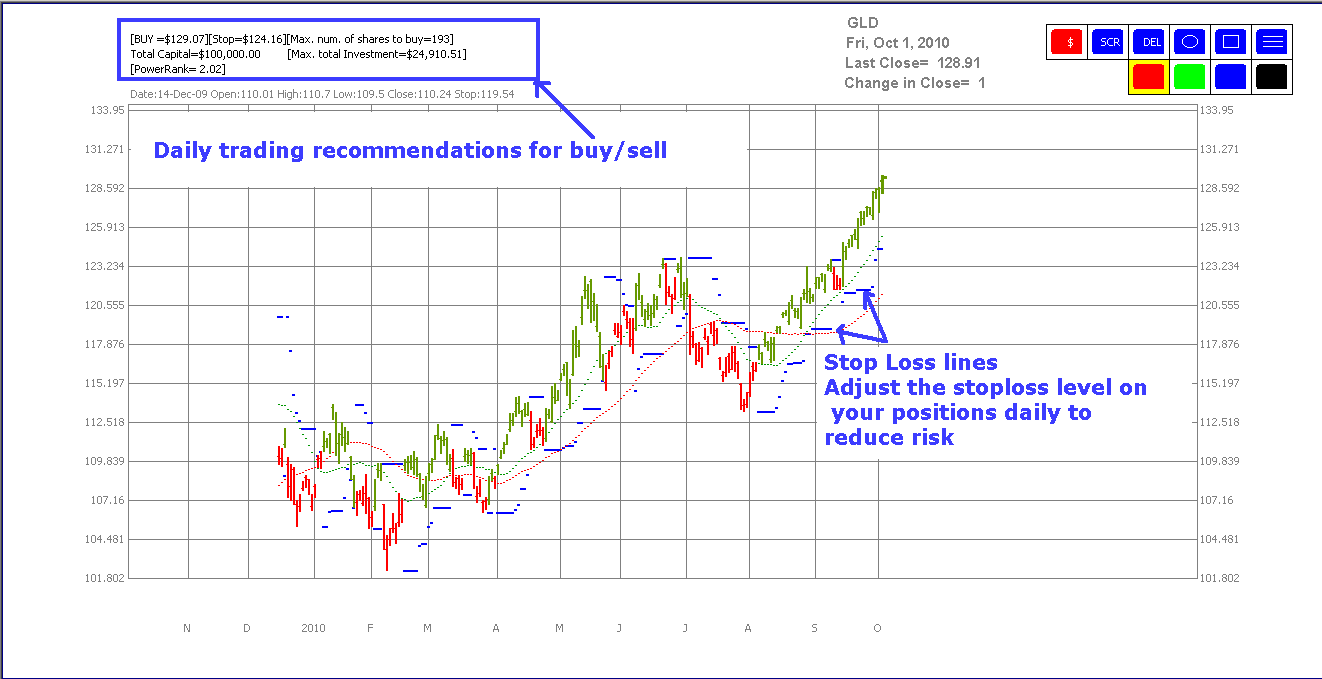
At present, the last bar is green in color. If the bar is green in color, you can buy the stock and The buy sell recommendation on top left says that if you have $100,000 portfolio, you can buy maximum of 193 shares at the buy price of 129.07 and you should place a stop loss sell order at 124.16.
Please note that 193 shares is the maximum number of shares you can purchase based on risk control. You can purchase less than that.
The stop loss level is shown by the blue dotted line below the price chart. Every day, you should check the stop loss price and move it upwards. By doing that, you are reducing the risk. Daily, keep on moving the stop loss to the level shown on the chart. By doing so, if the stock does not move a lot, you will be stopped out. You do not want to waste your time on losers.
Also, if the stock bar turns red, you should sell the stock as it is no longer bullish. Please note that as the trend is still bullish, you should just sell to offset your long position.
You should not attempt to short the stock.
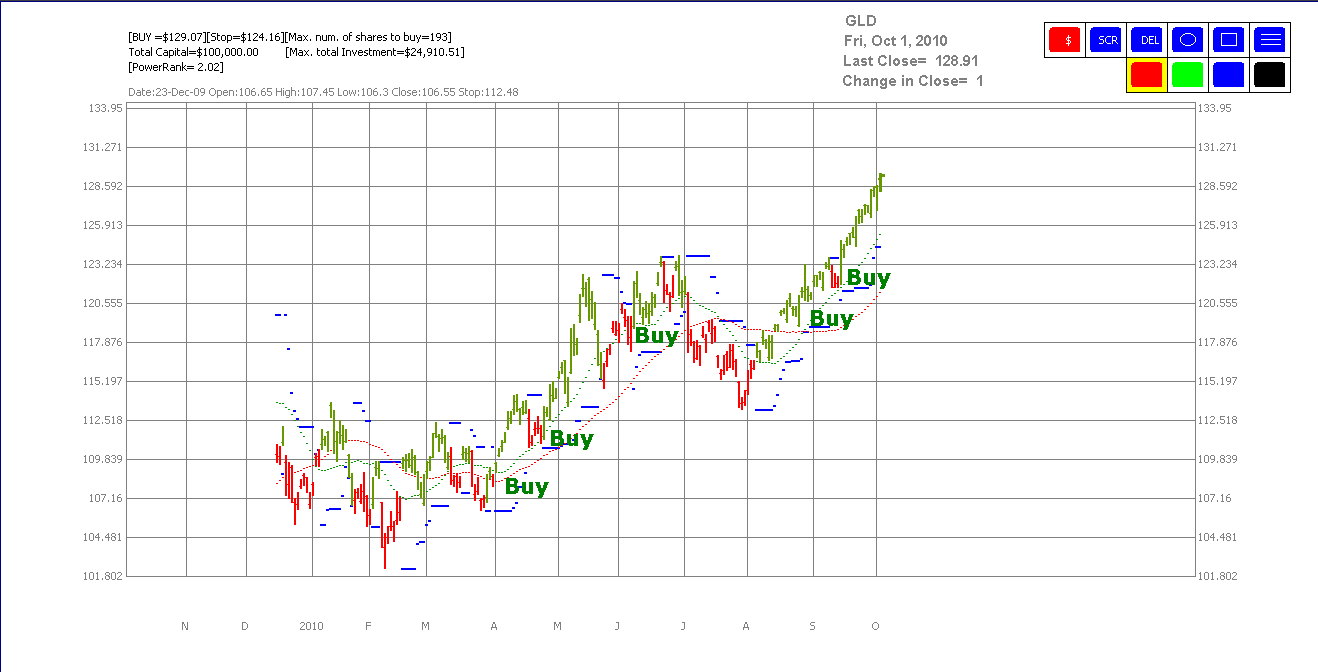
This is the first method: You buy if the stock is bullish and the bar is green in color.
There is a second method also. Try both methods and use the method which is convenient for you.
In this second method, you buy the stock when it retraces back to the 20 day moving average, Also, you place the stoploss below the 50 days moving average.
The advantage of this method is that the initial risk is minimised, since the stock has retraced back and is now poised to go up again.
The disadvantage of this method is that you have to keep waiting for the stock to come down and touch the 20 day moving average.
Also, if the uptrend is very strong, the stock may never come down to touch the 20 day moving average and you may miss the boat.
You can try a combination of the two methods. Buy using the first method and add to your positions when the stock retraces back to the 20 day moving average.
Let us look at another example.
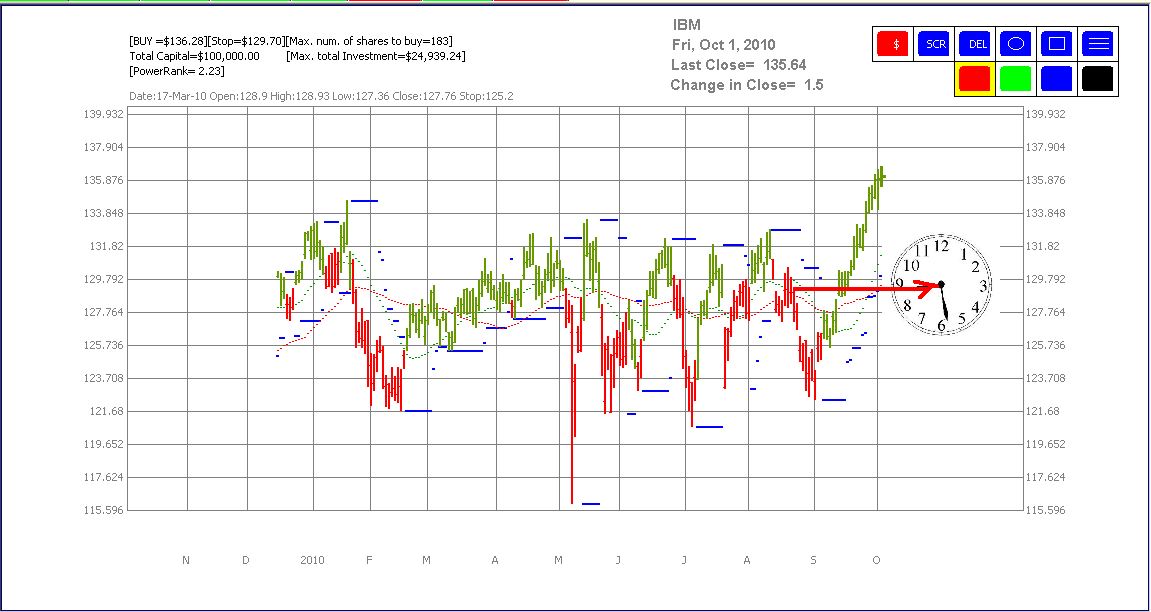
Look at the stock of IBM
First, the 20 day moving average is above the 50 day moving average. (which is bullish) But, the two moving average lines are not moving smoothly upwards parallel to each other. The stock is touching the 50 day moving average many times. The moving average dotted lines are not pointing upwards (between 1 o clock and 2 o clock clock positions), So, we ignore this stock for now because it is not trending. We do not want to waste our time and money on non-performing stocks. NEXT STOCK please!!
Let us look at another stock to make this concept clear. Let us look at AT and T phone company(Ticker symbol:T)
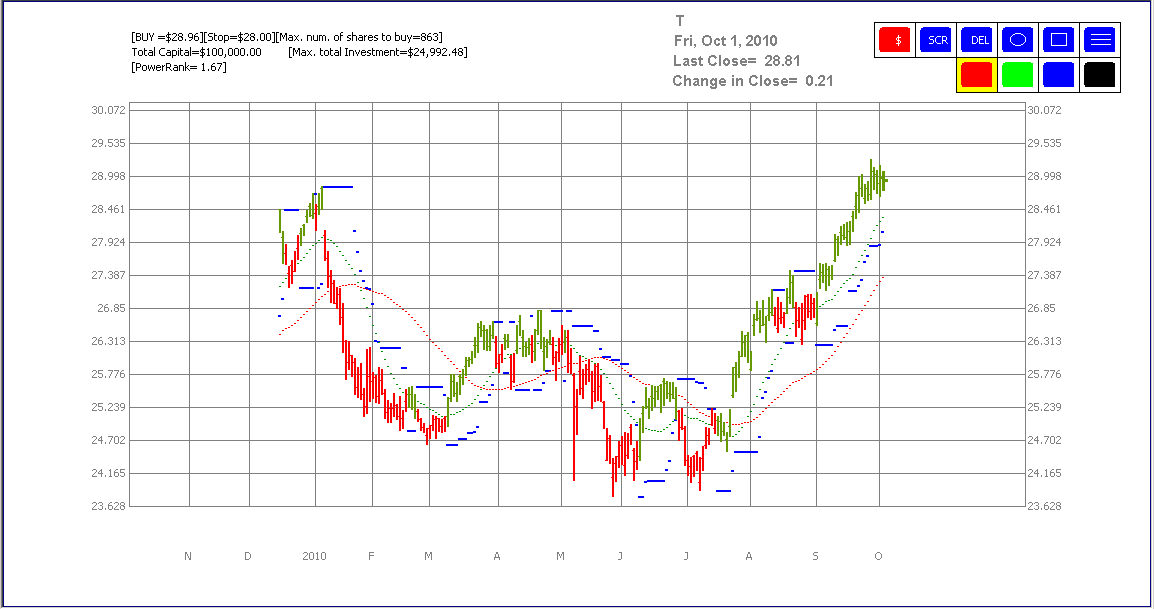
Let us check the trend.
1. The 20 day average line is above the 50 day average line
2. The moving average dotted lines are pointing upwards (between 1 o clock and 2 o clock clock positions),
3. The moving average lines move smoothly upwards, almost parallel to each other.
4. The Power Ranking is not greater than 3 It would have been better if the Power Ranking were above 3.
Also, the stock does not go below the 50 day moving average. When the stock pulled back, it just briefly touched the 20 day moving average and then bounced up. This shows that the trend is strong for now.
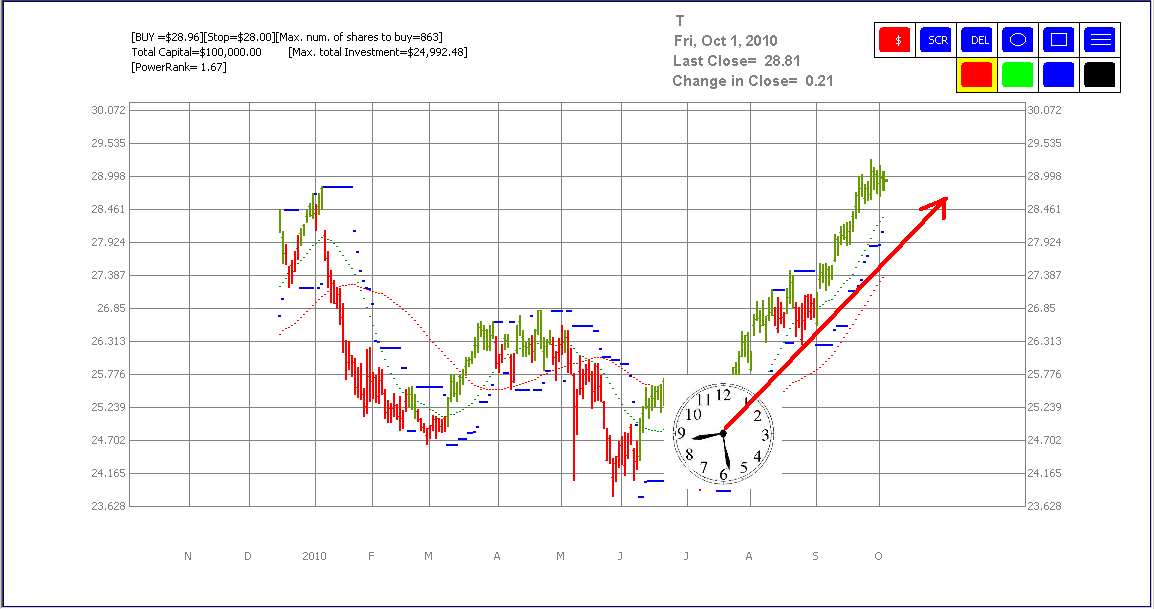
So, based on the above facts, if we have a $100,000 portfolio, we can buy a maximum of 863 shares at $28.96 and place the stop loss at $ 28, which is shown on the chart by the blue dotted line below the latest price bar.
Note: You should adjust DreamTai default portfolio amount to your account capital. To do so, select Configure=>Initial Capital from the menu.
Study the concept of Stock Kisses in the links below.
http://dreamtai.blogspot.com/2007/01/what-are-stock-kisses.html
http://dreamtai.blogspot.com/2007/05/dreamtai-tutorial-may-21-2007.html
Here is a simple trading system video using the stock kisses principle.
You can create your own trading rules using stock kisses principle.
The main thing to remember is to buy during retracements in an uptrend.
3. FOR EXPERIENCED TRADERS (LEVEL 3 Traders) PATTERN TRADERS
Here, you know the market structure and you can trade using patterns like head and shoulders, inverted triangles, Flag patterns, candlestick trading. You can refer any good technical analysis book for such patterns.
4. Master Traders (Level 4 traders)Master Traders PRICE ACTION TRADERS
As you gain more experience, you will start discarding the indicators and the systems. You just "know" what the market will do next looking at the price action and the volume. At that point, the knowledge is "internalized" inside you.
If you are an experienced driver, you can drive with one hand on the steering wheel and talk with your passengers in the car.
You do not need to concentrate on the act of driving the car. At this point, you will be able to make profits day trading or trading on a short time frame (like a hourly chart or a 4 hour chart).
This is how the trader will evolve. Granted that it is hard work. There is no system or trading software which can make you a millionaire in a few months.